This post has been republished from https://streets.mn/2020/03/26/building-a-complete-abrt-system-in-minneapolis/. Check out the comment section here for reactions to my proposal!
aBRT is by far the most important transit project in the state. While it doesn’t get the same attention as pricier projects like the light rail or suburban BRT, aBRT has proven to be the single most effective and cost-efficient way to grow ridership and improve service quality in the Twin Cities.
However, we are approaching aBRT far too slowly. Instead of rapidly building a complete aBRT system for everybody, we are incrementally adding new lines one at a time, each taking several years to individually find funding and build political capital.
In this post, I will present a vision for a complete aBRT system in Minneapolis – a system where every single local bus route has been replaced with a high-quality aBRT line. I will also estimate the cost of building and operating the system and discuss the system’s benefits. While this post does focus exclusively on Minneapolis, this vision also applies directly to St. Paul and many first-ring suburban neighborhoods.
What is aBRT?
Arterial Bus Rapid Transit, or aBRT, is essentially the upgraded version of local bus transit. aBRT routes contain many of the same elements found in traditional BRT or LRT. Limited stop patterns, signal priority, level boarding, and off-board fare collection result in a 25-30% increase in speed. Bus stations will be upgraded with real-time information, heated shelters, and in some cases bike/scooter parking, making for a more comfortable trip. aBRT also has reliable service and high frequency, with 10 minute headways throughout the day, including weekends. Of note is that aBRT operates in mixed lane traffic – while this can slow down service, it also significantly brings down the cost of implementation, both financially and politically.
In 2016, we built our first aBRT line, the A Line, and the response has been incredibly positive. Christof Spieler, a notable planner who oversaw Houston’s recent transit redesign, calls the A Line “one of the best bus routes in the country”. Streetsblog USA says that the “the A Line has features that should be common on most bus routes”. Most importantly, riders have flocked to the line – in its first year alone, ridership increased over 30%! Ridership has continued to grow in the years since, in stark contrast to ridership losses in the overall system and general ridership trends across the country.
The C Line, our second aBRT line, opened in 2019 and mostly replaced Route 19 in North Minneapolis. In the time since the line opened, we again saw an immediate 30% ridership jump.
In spite of these great numbers, investment in aBRT has dried up. Funding for the next three planned aBRT lines has stalled in the legislature, and several projects that could be strong aBRT corridors (Nicollet-Central, West Broadway, Riverview), are instead proceeding as expensive streetcar projects that have 10x the price with no additional transit benefits for riders. If we want our transit system to keep up with growth in the metro area, aBRT needs to be our number one priority for investment.
Choosing the Routes
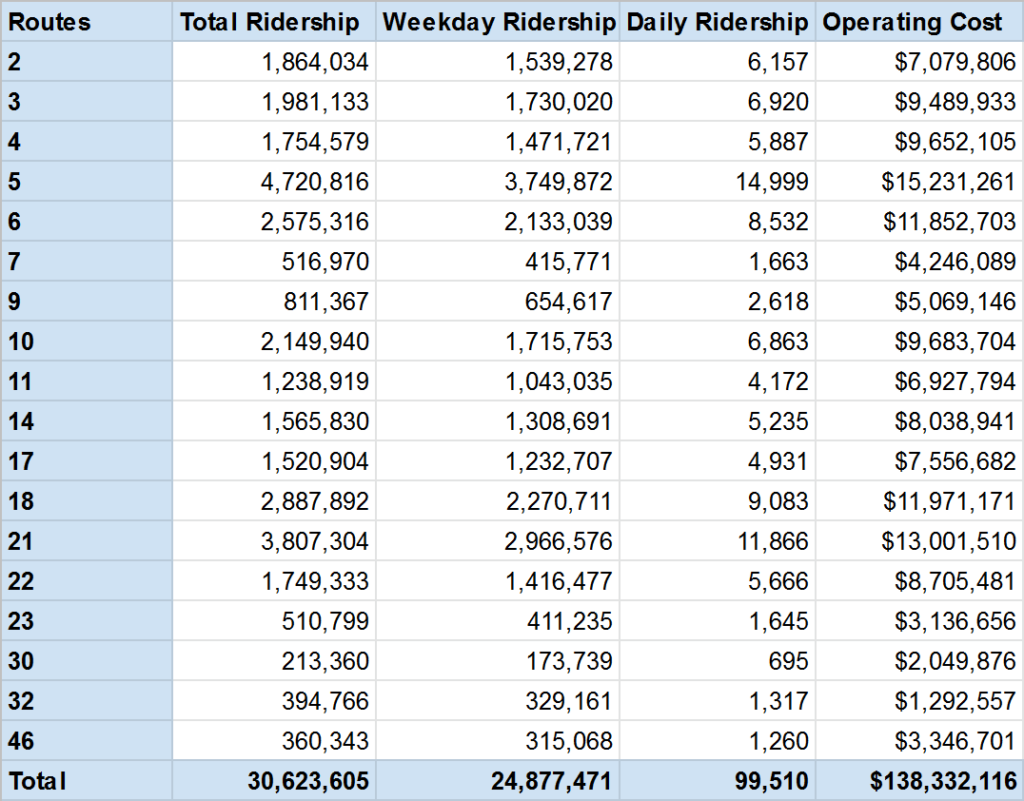
First, we need to define the scope of buses we are upgrading to aBRT. As my baseline, I chose to take every local bus which primarily serves the city of Minneapolis proper, and has a midday frequency of at least every 30 minutes. This frequency requirement disqualifies routes 12, 25, 27, and 39. Additionally, Route 19 has already been upgraded to aBRT, so I don’t include it in the analysis.
In total, this gives us 18 routes, shown in the table below. I have also displayed a few route statistics based on 2017 Met Council data.
Designing the System
My main goal for this thought exercise was to upgrade routes inside Minneapolis proper, providing a boundary (however arbitrary) for what I define as urban. Therefore, I mostly just picked segments of routes inside Minneapolis proper to convert to aBRT, most routes don’t extend far outside the city borders.
There were a few routes which I needed to extend farther out from Minneapolis because they have significant service operations there, and I didn’t want to skew my analysis. While picking boundaries for these routes, I simply either used the entire route, or extended service outside Minneapolis until frequency dropped off. Also, since I thought it made sense operationally, I combined a few pairs of routes into single lines: 3+C Line, 4P+11, 10+18, and 46+A Line.
Using these guidelines, I constructed the below aBRT system. Routes are color coded based on if they are ‘downtown’ or ‘crosstown’ routes. For visual context, I’ve included the Green, Blue, and Orange lines, as well as the Minneapolis city boundaries. Click here to play around with the map yourself.
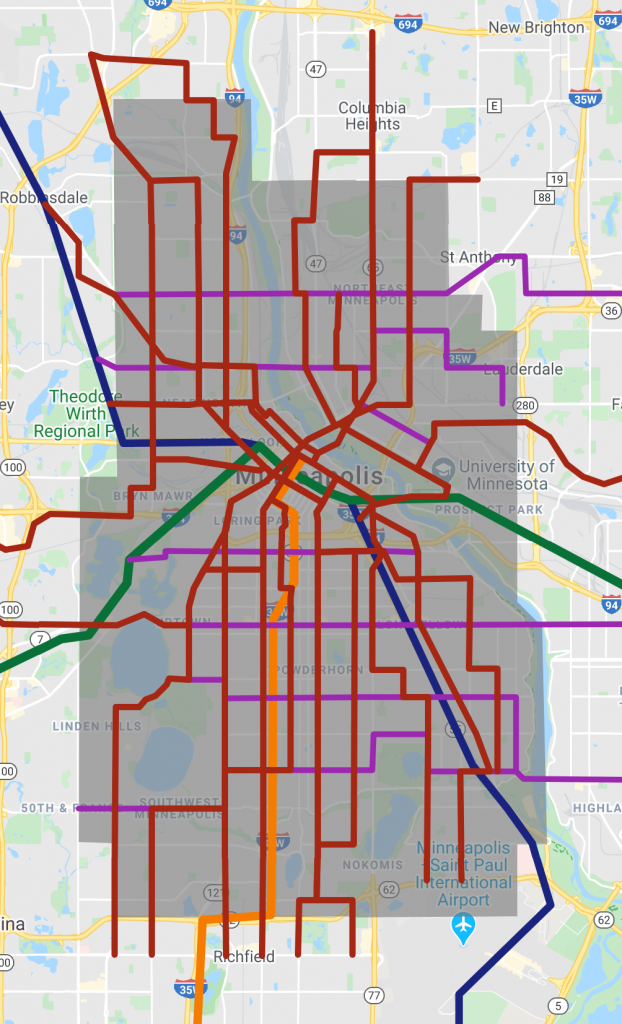
I want to mention that this system is not intended to be a final proposal for implementation, just a sample network to demonstrate my ideas.
Ridership Projections
The existing set of 18 local routes in Minneapolis currently has an average daily ridership of 100,000. Based on data from the A Line and C Line, we would expect a ridership increase of about 30% after implementing aBRT, or about 30,000 total. However this is a very low estimate, because it doesn’t take into account the total system growing.
Taking the Route 9 corridor, we might predict a 30% ridership increase if we implemented aBRT by itself. However, Route 9 intersects 14 new aBRT lines in the system, so we aren’t improving Route 9 service in a vacuum, we are also adding 14 new high-quality lines to transfer to as well. To give a specific example, transferring from Route 9 to Route 46 suddenly becomes a lot more feasible when each route has 10 minute headways instead of 30 minute headways, the average transfer wait is now only 5 minutes.
With every new line in the aBRT system, this transferring ability to grows exponentially. Consider that in the current transit system, there are exactly 17 transfer points (by my count) with an expected wait time of 5 minutes or less both ways, throughout the day. In the new aBRT system, the number of transfer points with a 5 minute wait time would grow to over 150!
For these reasons, I would estimate a ridership increase of at least 50%. Though this is a somewhat handwavey estimate, it seems realistic. Overall, this would mean a ridership increase of 50,000, and a total daily aBRT ridership of over 150,000! For context, Minneapolis’s population is about 450,000, and the total daily ridership across the entire metro area is about 300,000.
How much will it cost?
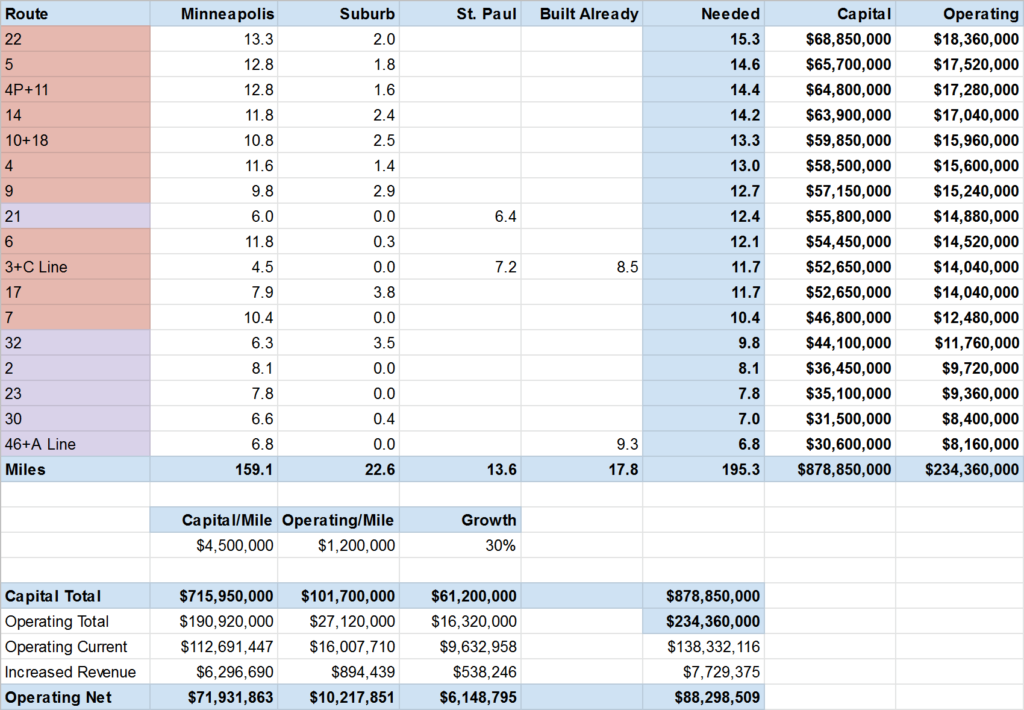
Overall, I estimate that the new aBRT system would cost about $879 million to build, based on the A and C Lines. Using the low ridership increase estimate of 30%, the system would have a net increase of $88 million in operational costs, again based on the A and C Lines.
These costs may seem large at first, but compare it to other proposed transit projects in the Twin Cities (mostly compiled from here):
- The Green Line LRT Extension will cost $2 billion dollars, with annual operating costs of $39 million. Average daily weekday ridership is projected at 29,000.
- The Blue Line LRT Extension will cost $1.5 billion with $34 million in annual operating costs, Ridership is projected at 27,000.
- The Orange Line BRT will cost $150 million, with $8 million in annual operating costs. Ridership is projected at 11,000. Current ridership on the 535 is about 1,500, and it remains to be seen if the Orange Line can increase ridership by over 600%…
- The Gold Line BRT will cost $420 million, with $5 million in annual operating costs. Ridership is projected at 8,000.
- The Rush Line BRT will cost $538 million, with $11 million in annual operating costs. Ridership is projected at 5,700-9,700.
- The Riverview Streetcar will cost $2.1 billion dollars, with $36 million in annual operating costs. Ridership is projected to increase by 2,700.
- The Nicollet-Central Streetcar will cost $276 million, with $14 million in annual operating costs. Ridership is projected to increase by 1,400.
- The West Broadway Streetcar will cost $256 million, with $10 million in annual operating costs. Total ridership is projected at 3,900, though I couldn’t find what the ridership increase is over the current Route 14.
After looking at other projects, $870 million is an incredibly cheap cost for 30,000-50,000 new riders and likely the best core bus system in the entire country.
Compared to aBRT, streetcars are an example of especially poor transit value. On the whole, streetcars provide no significant mobility benefits for transit riders, in terms of speed or coverage. Instead, advocates justify streetcars by claiming that they stimulate more economic development and increase ridership, due to rail bias. Even if we take this to be true, the argument falls apart once we consider the total cost of the line.
For example, in the West Broadway corridor, the policy committee had two options: a 5-mile, $256 million streetcar, or a 7-mile, $40 million aBRT line. In a 6-5 vote, they chose the streetcar option. However this is an unfair comparison. Imagine the vote was instead between a 5-mile, $256 million streetcar, or a 50-mile, $250 million aBRT network – the logic suddenly flips. Once you compare apples to apples, aBRT clearly comes ahead in every measure.
Fulfilling the Minneapolis Transportation Action Plan
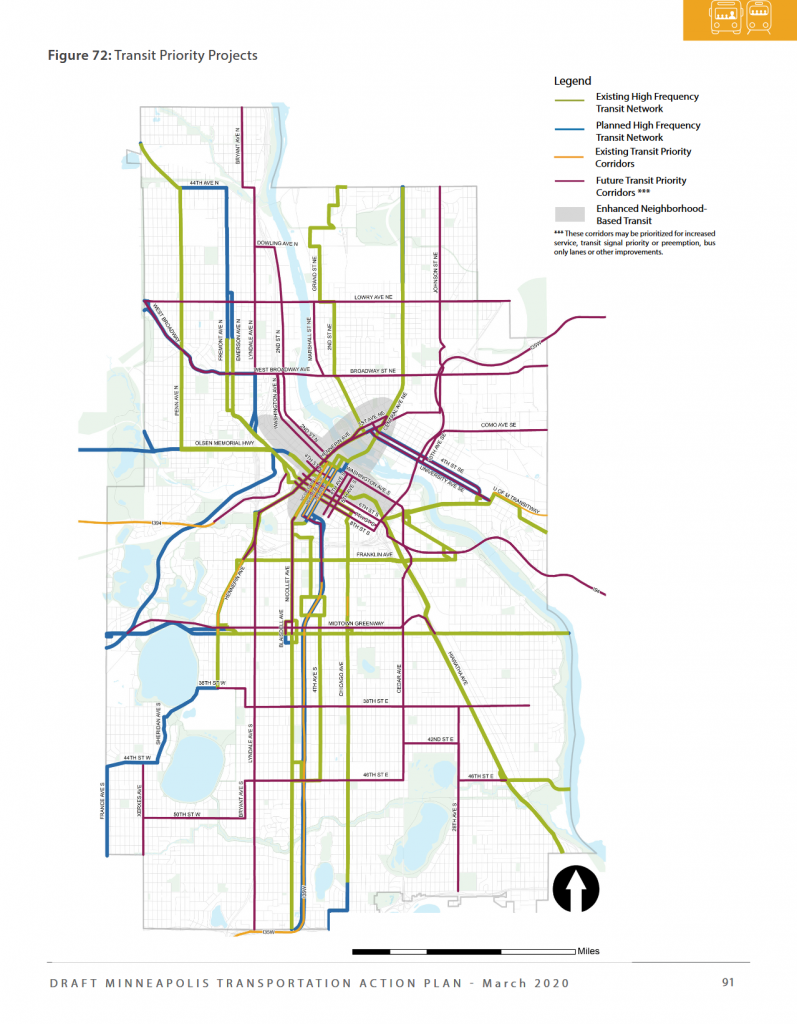
Minneapolis recently released its Transportation Action Plan draft. I actually started writing this post before this draft was released, but the vision expressed in the plan is highly aligned with the goal of a complete aBRT network. Some highlights include:
- 75% of city residents located within a quarter mile and 90% of residents located within a half mile walk of high frequency transit corridors (In my example system, these percentages are ~95% and 100%, respectively.)
- Increase the high frequency network from 15 to 10 minutes or better (aBRT does this)
- Improve the quality and expand the high frequency network of local crosstown service (This is done by converting local routes 46, 23, 21, 2, 30, and 32 to aBRT)
If our politicians are serious about building a quality transit network to serve their residents equitably and effectively, aBRT has to be the first place to start.
Final Thoughts
It’s clear that the money for this system already exists. The cost of 9 miles of streetcar (Nicollet and W.Broadway) alone would fund 75% of Minneapolis’s share of the aBRT system. If we want to extend aBRT to the eastern metro, just the money from the Riverview streetcar would fund a complete aBRT system in St. Paul three times over. Suburban aBRT extensions, where practical, are also far cheaper than current suburban transit expansion proposals.
My intention with this post was not to necessarily create the best possible transit system to serve Minneapolis – there are plenty of places where we can improve on the current network of bus routes without copying it exactly. I’m also not looking for a specific funding plan for the system, since the benefits of aBRT don’t depend on the funding source.
Instead, what I want readers to understand is that creating a dramatically improved transit network is not an impossible task. With a relatively small budget and a bit of political will, we could realistically upgrade our entire transportation network. Making aBRT the standard level of service for all of our local bus routes is one example of a solution that would allow us to fund a world-class transportation system with fast, frequent, and reliable transit service for all.


0 Comments