Last week, I went over some functions I created to compress a chess board state into a set of integers, based on the component functions created during the Stockfish evaluation process.
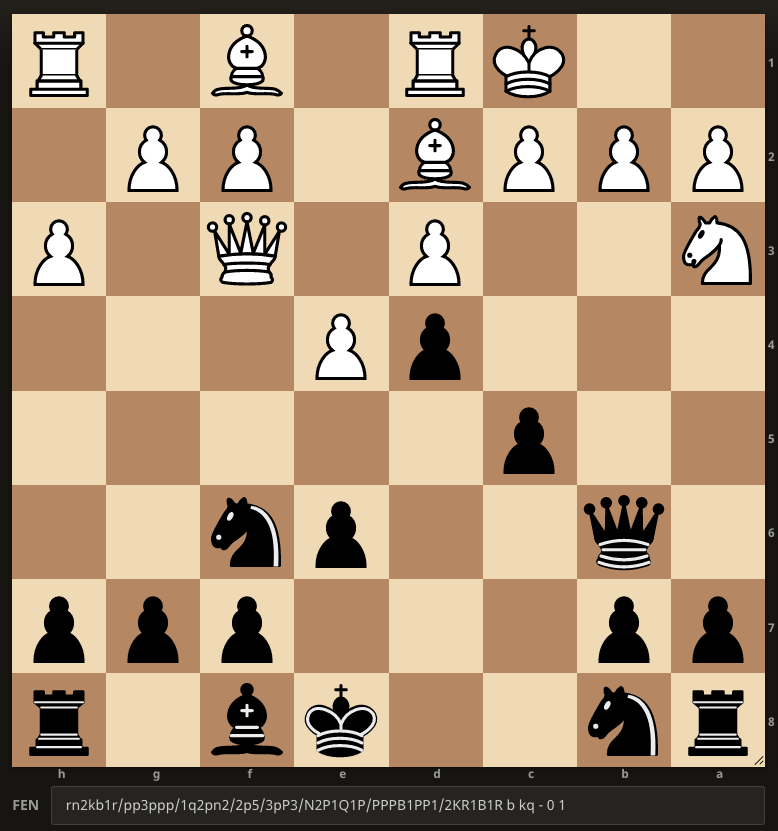
For example, in the above position, we get the compressed board state of (0.9,0.05,-0.05,-0.42,0.31,0.0,-0.3,0.0). These values correspond to Material, Imbalance, Mobility, King Safety, Threats, Passed Pawns, Space, and Winnable. These values pass an initial sanity check for usefulness. For example, Passed Pawns is 0.0 because neither side has any passed pawns, or a chance to create any passed pawns in the near future. Space is -0.3 because Black has slightly more space here. Material is 0.9, presumably due to White’s bishop pair.
There are a few notable details about this representation.
- The amount of space this compressed board state takes up is very small, only 8 discrete floating points. Compare this to a mapping of 16 pieces over 64 squares!
- Because it’s possible for multiple real board states to compress to a single 8-tuple, we introduce a lot of uncertainty into the model. This means that, while we may be relatively certain that Stockfish is picking the best move for a given FEN, we are very much not sure that the state-state pair that Stockfish recommends is the best (in an expected value sense) for the given 8-tuple.
- The components of the board state actually represent meaningful aspects of the board and can be used to make decisions about the current state, thought these decisions will be much worse than having the full game state, of course.
- Even though this compression process calls Stockfish, it only looks at the current board position, without doing any lookahead at all. This has both good and bad sides. On one hand, this makes calculation very fast, about 0.5 seconds per board position during initial tests. However, it does make the evaluation much less meaningful in tactical sequences. For example, if White takes Black’s queen on one move, the evaluation will wildly swing in White’s favor, ignoring the obvious recapture next turn to equalize. Actually, for this reason, the Stockfish devs disabled evaluation in the most extreme tactical position, when one side is in check. It remains to be seen if this tactical position shortcoming will be an issue for us...
Once we can calculate this compression for any position, the next step is calculate it on real positions, and see how humans deviate from optimality (Stockfish). Using the Lichess API, I downloaded the top 100 games from the current top 10 GMs on the Lichess Blitz Leaderboard. Then, I used the python-chess module to get a FEN string for each position between moves 10 and 30 where it was our player of interest’s turn. The 10 to 30 cutoff is because I am using the Stockfish middlegame evaluation components, and I’m not sure how well they work in the endgame. I wrote all these FEN positions to a file, along with the move that the GM played. This gave me between 1000 to 2000 positions for each player to analyze.
For each of these FEN positions, I then calculated three compressed states: the current state, the state after the player’s move, and the state after the engine-selected optimal move (determined using a call to Stockfish via python-chess). For each player, I then calculated three statistics – the mean difference between the current state and the player’s chosen move, the mean difference between the current state and the engine’s chosen move, and the mean difference between the player’s chosen move and the engine’s chosen move. At the moment, I’m only really interested in the last statistic, but this might change depending on the direction I take the project.
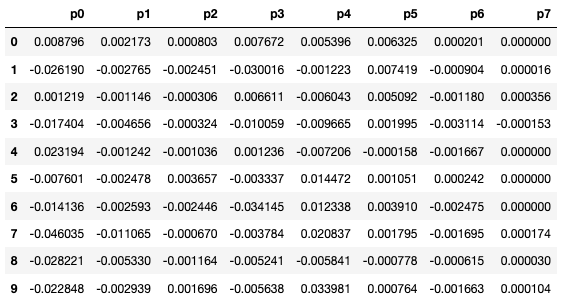
Once I’ve calculated these statistics, the fun part is comparing the players against each other! You can look at the table below for the statistics that I calculated. p0-p7 refer to the 8 components of the compressed state, and each row represents an individual player’s results.
However, this table is a little hard to look at, so I’ve applied a PCA dimension reduction function given by scikit-learn to reduce data to two columns (explaining about 83% of total variance). Now we’re able to plot the data!
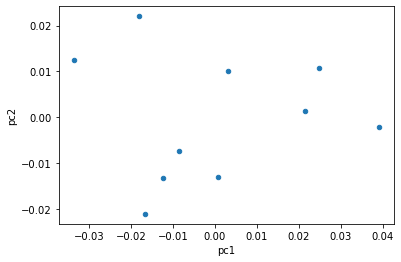
The goal of this was to hopefully see clusters of points, representing meaningful patterns among the players themselves. If you squint, you can maybe see some patterns, but mostly you can just see that we need more data. Fortunately with Lichess, we have all the data we could possibly analyze, it’s just a question of actually going through that data. On my personal computer, it takes about an hour to generate each of those points. I’m hoping to get access to some faster computers on campus, but we will have to make do for now. I’ll try to get as much data as possible before my next meeting with CJ.
In the meantime, I have a paper review for the rotation due in 3 days and I’m planning to upload it here as another blog post (because why not). See you then!


0 Comments