Introduction
During my final semester at the University of Minnesota this spring, I took an Urban Studies colloquium on Urban Analytics. The course was taught by Andrew Dahl, a former Data Analyst for the City of Minneapolis, and a part-time instructor at the University. Because the class only met once a week for half a semester, the scope of the course was quite narrow and mainly focused on using Tableau for data visualization.
To be honest, I didn’t find the class very instructive, as we went over topics too slowly for my taste. However, the course wasn’t exactly aimed at a Computer Science major like me. In fact, I was the only student in the 12-person class with a technical background; the rest were mainly Urban Studies majors or others in the Humanities. However, I don’t regret taking it, as I found it fun to work on the final project – the topic of this blog post. Plus, it was an easy A with minimal effort needed :).
During the course, we learned different how do to simple analytics in Tableau, like gathering and cleaning data, combining multiple datasets, and various forms of visualizations, all using datasets provided by Andrew. For the final project, we needed to find our own datasets that interested us and create a Tableau project which would either attempt to solve a problem, or lead to some insight.
When the final project was announced, I immediately knew that I wanted to my project to be about the transit system in the Twin Cities, since I’m a huge transportation nerd! After keeping the project in the back of my mind for a few days, I decided to investigate ridership frequency along the Green Line.
Light Rail Background
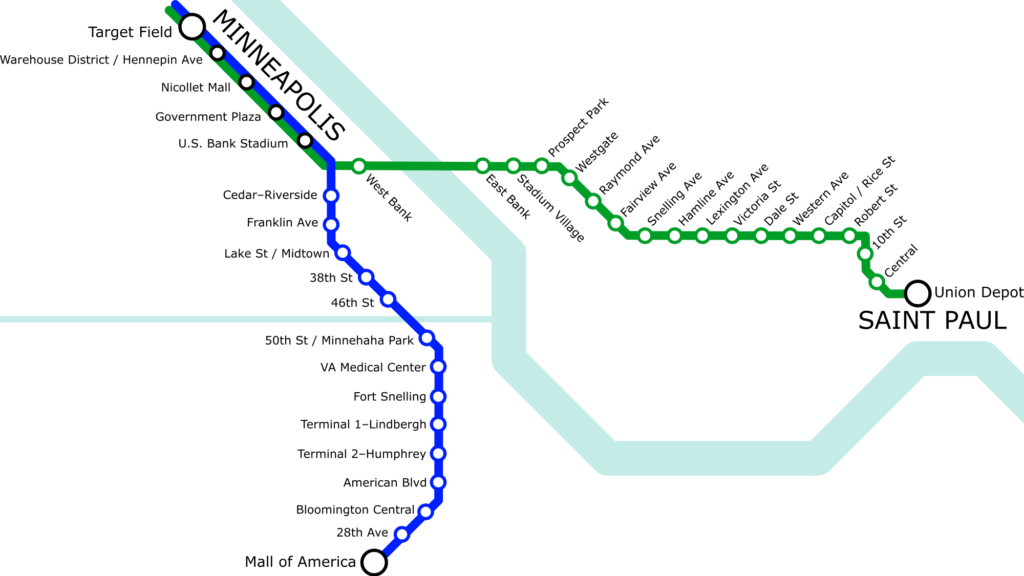
As a little bit of background, there are currently two light rail lines in the Twin Cities. The Blue Line goes between the Mall of America, MSP International Airport, and Downtown Minneapolis, while the Green Line goes between Downtown St. Paul, the University of Minnesota, and Downtown Minneapolis. When the Blue Line was constructed in 2004, Metro Transit operated the line at peak frequencies of every 7.5 minutes. However, when the Green Line started operations in 2014, frequencies were reduced to only every 10 minutes on both routes, as both lines share a track in Downtown Minneapolis which can only support trains every 5 minutes.
The goal of my project was to determine the feasibility of increasing frequencies on the on the light rail segments outside of downtown. Specifically, doubling the frequency of the Blue Line from Mall of America Station to US Bank Stadium Station, and the frequency of the Green Line between Union Depot Station and US Bank Stadium Station, by adding extra trains that travel up to US Bank Stadium Station, but not farther. I do this to avoid the shared track between US Bank Stadium Station and Target Field Station, but still facilitating easy transfers between lines at US Bank Stadium Station. For this rest of this post, Downtown Minneapolis will only refer to the stations between Target Field and Government Plaza and not US Bank Stadium Station, in order to keep the distinction between the segments of track we are comparing.
Analyzing the feasibility of physically doubling the frequency on these tracks is out of my domain expertise, but I instead want to understand if ridership would support operating trains every 5 minutes outside Downtown Minneapolis. Anecdotally, when I lived near Stadium Village Station in college, I used to ride the light rail between 2-6 times a day, and there would almost always be a crowd of people waiting for a train. During rush hour, the trains would be absolutely packed and even outside of rush hour, trains were usually relatively full. However, I didn’t have as much experience with other areas of the system, which is why I chose to do this project!
One way to roughly determine if ridership would support doubling frequencies outside Downtown Minneapolis is by analyzing current ridership. If a majority of riders are using the light rail to get to destinations outside Downtown Minneapolis, it may follow that increased frequency to these destinations is warranted. Of course, there are other factors for analysis we can consider, such as boardings over time of day, demographics about the region, and comparisons to transit systems in other cities. I will discuss these options further below.
Data Collection
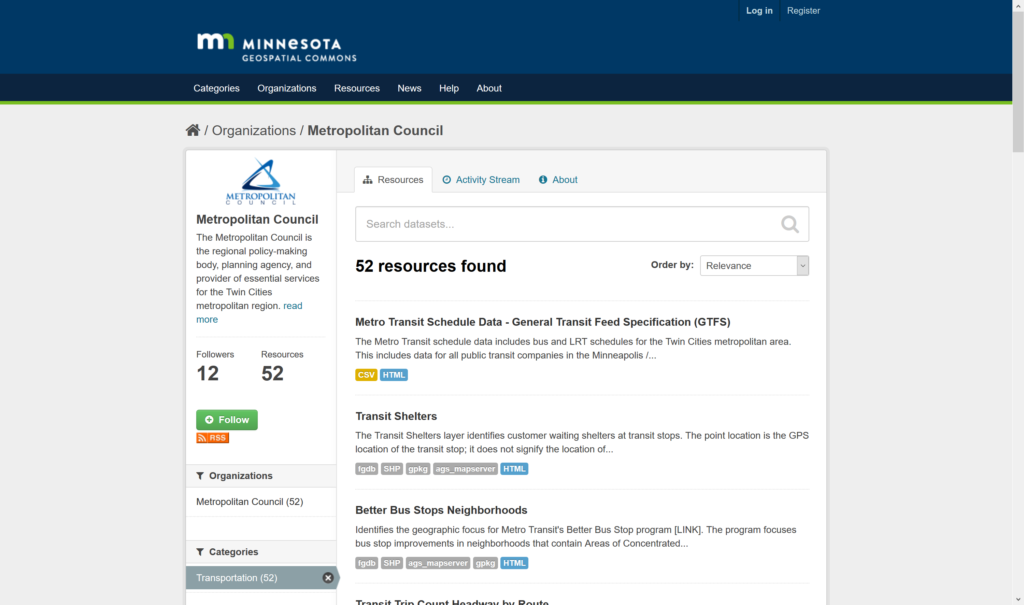
With any new analytics problem, the most immediate decision is which datasets to use. For this final project specifically, we were required to use one spatial point dataset and one spatial polygon dataset. The State of Minnesota publishes their transportation datasets, along with other GIS data at the Minnesota Geospatial Commons. From this site, I ended up selecting datasets for analysis: Transit boardings and Schedules. Because Tableau can become very slow while dealing with unions of large files, I used some simple Python code to remove all rows on bus stops and commuter rail stations, leaving only data on light rail stations. By doing this, I was able to reduce my Schedule dataset from 312mb to 0.6mb and my Boardings dataset from 6mb to 4kb.
However, data collection is never allowed to be easy and this remained true here as well. The Transit boarding dataset used the name of the station, stop_on, to uniquely identify each station, while the Schedule dataset used a number, stop_id, to identify each station. To make this more complicated, each station actually had two stop_ids. For the Green line, each station had unique stop_id values for the Eastbound and Westbound directions, while the Blue line had unique values for Northbound and Southbound directions. For the shared stations in Downtown Minneapolis, each station had four unique stop_id values, one for each cardinal direction!
In order to join these datasets together, I needed to introduce a third dataset, Transit Stops, to link boardings and schedules. This also fulfilled my spatial point dataset requirement, as my first two datasets were csv files, not spatial files.
Finally, I needed a way to combine all the stop_id values from each station into one point. I could have done this using the transit stop data alone, but because the assignment required us to use a spatial polygon dataset, I used the Census Tiger Block dataset. As it turns out that each light rail station has a unique block and each station’s stops are all located in the same block, so I could aggregate points with a simple Geometry intersection. However, if I were to repeat this project without the spatial polygon requirement, I would have simply used the transit stop data itself to perform this aggregation, as the census gives extra overhead to the data.
Below, we can see the final graph of dataset interactions in Tableau
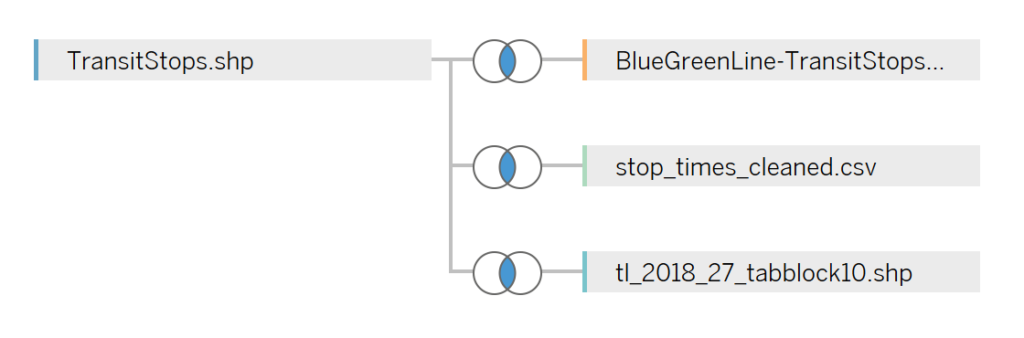
Tableau Visualizations
For this project, I created two visualizations – one for the Green Line and one for the Blue Line.
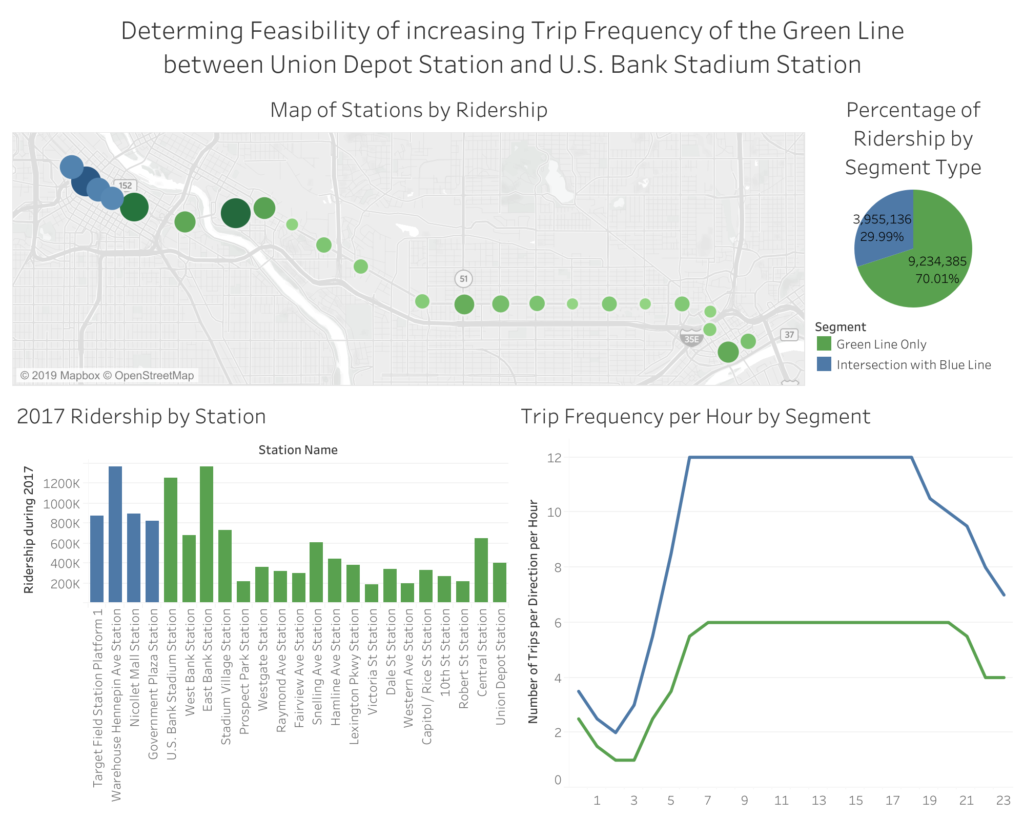
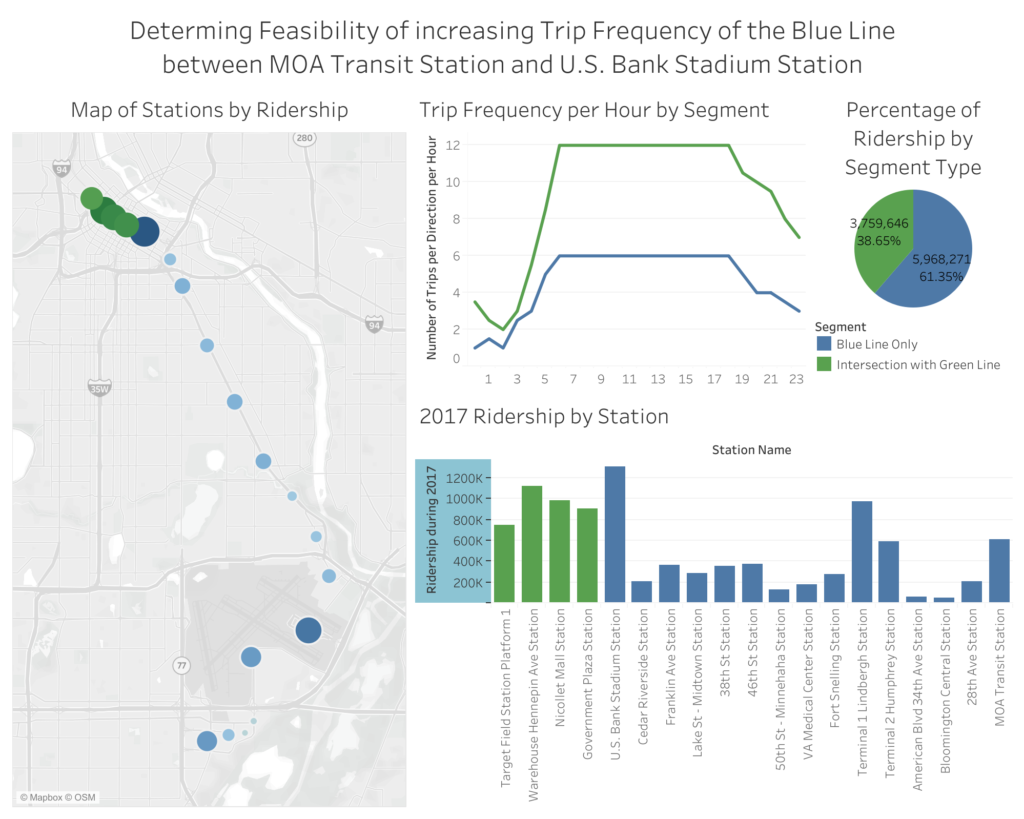
Both visualizations show four different types of graphs – a map of each station with size representing number of boardings, a bar chart showing the number boardings directly, a pie chart comparing ridership in Downtown Minneapolis to areas outside Downtown Minneapolis, and a line graph visualizing frequency.
In each graph, I use a blue/green color scheme to differentiate shared Downtown Minneapolis track and other track. In my Green Line visualization, green represents stations only on the Green Line, while blue represents stations shared between the Blue and Green lines. In the Blue Line visualization, blue represents stations only on the Blue Line, while green represents stations shared between the Blue and Green lines. Note that US Bank Stadium Station is not marked as a shared station, because in my hypothetical increased frequency scenarios, light rail frequencies will be increasing from MOA/Union Depot stations up to and including US Bank Stadium Station, to facilitate transfers between the light rail lines.
Analysis
In both the Green Line and Blue Line images, the map and bar chart both show different ways to visualize boardings at each station, with the bar charts showing more numerical data, while the maps show a more pleasant-looking overview of the system. We can see that all of the stations in Downtown Minneapolis see heavy use, and some of the more important stations outside Downtown Minneapolis are the Airport and MOA on the Blue Line, and the UofM, Snelling, and Central on the Green Line. I don’t know too much about the geography of Downtown St. Paul, but the importance of the other stations lines up with my understanding of the system as a whole.
The pie charts aggregate the station boarding data into our two station categories for easy ridership comparison. We can see that over 70% of Green Line riders and 60% of Blue Line Riders are boarding outside Downtown Minneapolis. This does lend significance to the idea that the majority of riders are not going into Downtown Minneapolis, but there are some limitations, as our dataset only contains trip boardings and not trip alighting. Without more information on where people are going, it is possible to assume that about 30% of Green Line boardings are headed towards Downtown Minneapolis, so only 40% of all trips exclude Downtown Minneapolis altogether. With the same logic, this number drops to 20% for the Blue Line.
The frequency line graph simply compares the trip frequency in Downtown Minneapolis and the areas outside Downtown Minneapolis. The areas in the line intersection have roughly double the frequency as the areas with only one line alone, which aligns with our intuition, as there are double the number of lines in Downtown Minneapolis. To be honest though, this graph is not very useful for our analysis and I only included it because one of the assignment requirements was to include a temporal line graph - this data seemed like the most relevant.
Conclusions
We have found that at least 40% of Green Line rides and 20% of Blue Line rides take place entirely outside Downtown Minneapolis. While our results may indicate that increased frequency outside Downtown Minneapolis is warranted, especially on the Green Line, we cannot make any strong conclusions without more data.
Along with daily ridership, some other statistics that we may use to further our analysis are boardings over time of day, region demographics, and comparisons with other transit systems. However, no data is publicly available on boardings over time of day and since I only follow Urban Planning as a hobby, I personally do not have enough domain expertise to create meaningful conclusions from these demographics, so the first two options are out. I could pursue comparisons with other transit systems, but I would need to put more effort into finding datasets, since each city publishes their data separately, in a different format. I may make a follow-up post on this topic in the future, since it would give me great experience with data cleaning at the very least :).
If you’re interested in reading more on the idea of increasing frequency outside Downtown Minneapolis, David Levinson wrote an opinion piece advocating for a similar idea – adding a new direct line between Downtown St. Paul and the Mall of America by following existing light rail tracks. I actually didn’t see this piece until after I completed my own assignment, but it’s good to see that this idea has been brought up before!
Let me know in the comments or email if you have any of your own thoughts on this idea, or if you just want to offer feedback on my post! This is actually my first ever blog post, but I already have a few more ideas lined up based on stuff I’ve been working on recently, so look to see my next post in a week or so.
See you soon!
Saumik
Featured photo by Metro Transit


_light_rail_stations#/media/File:Metro_light_rail_lines_only.svg)
2 Comments
Toekneechin · June 18, 2019 at 11:04pm
Wow very interesting.
michael · June 18, 2019 at 11:15pm
very cool, Toe Knee Chin